import plotly.io as pio
import plotly.express as px
from IPython.display import IFrame
import pandas as pd
# Adapted from: https://stackoverflow.com/questions/58766305/is-there-any-way-to-implement-stacked-or-grouped-bar-charts-in-plotly-express
def px_stacked_bar(df, color_name='Metric', y_name='Metrics', **pxargs):
idx_col = df.index.name
m = pd.melt(df.reset_index(), id_vars=idx_col, var_name=color_name, value_name=y_name)
# For Plotly colour sequences see: https://plotly.com/python/discrete-color/
return px.bar(m, x=idx_col, y=y_name, color=color_name, **pxargs,
color_discrete_sequence=px.colors.qualitative.Pastel1)
# Collect metric counts
dataset = data['dataset']
numParts = dataset['partCount']
# Initialise dicts for the stacked bar plot
labels = {0: 'Dataset and Parts', 1: 'Dataset (%s)' % dataset['publicationYear']}
citationCounts = {}
viewCounts = {}
downloadCounts = {}
# Collect dataset/part labels
partCnt = 0
for node in dataset['parts']['nodes']:
labels[2 + partCnt] = 'Part %d (%s)' % ((partCnt + 1), node['publicationYear'])
partCnt += 1
# Initialise aggregated metric counts (key: 0) and populate parent dataset metric counts (key: 1)
i = 0
while (i < 2):
citationCounts[i] = dataset['citationCount']
viewCounts[i] = dataset['viewCount']
downloadCounts[i] = dataset['downloadCount']
i += 1
# Populate metric counts for individual parts (key: 2 + partCnt) and add them to the aggregated counts (key: 0)
partCnt = 0
for node in dataset['parts']['nodes']:
citationCounts[0] += node['citationCount']
viewCounts[0] += node['viewCount']
downloadCounts[0] += node['downloadCount']
citationCounts[2 + partCnt] = node['citationCount']
viewCounts[2 + partCnt] = node['viewCount']
downloadCounts[2 + partCnt] = node['downloadCount']
partCnt += 1
# Create stacked bar plot
df = pd.DataFrame({'Dataset/Parts': labels,
'Citations': citationCounts,
'Views': viewCounts,
'Downloads': downloadCounts})
fig = px_stacked_bar(df.set_index('Dataset/Parts'), y_name = "Counts")
# Set plot background to transparent
fig.update_layout({
'plot_bgcolor': 'rgba(0, 0, 0, 0)',
'paper_bgcolor': 'rgba(0, 0, 0, 0)'
})
# Write interactive plot out to html file
# pio.write_html(fig, file='out.html')
# Display plot from the saved html file
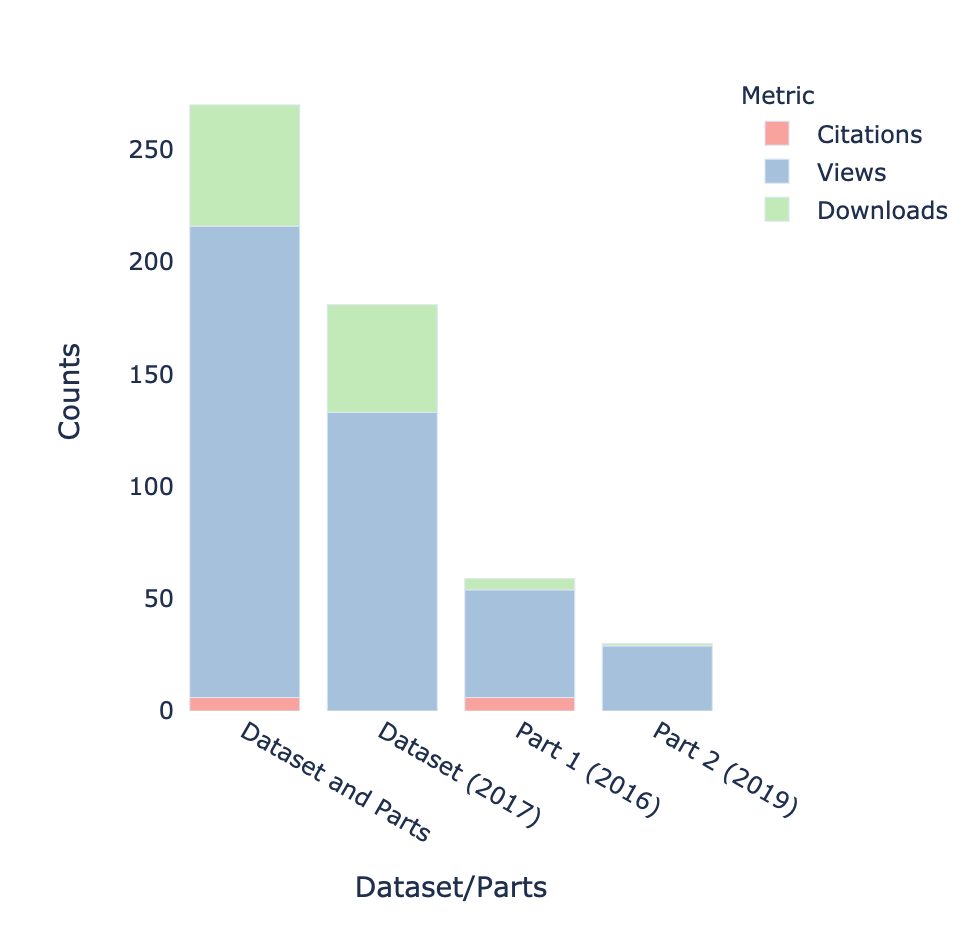
display(Markdown("Citations, views and downloads counts for [2014 TCCON Data Release dataset](https://doi.org/10.14291/tccon.ggg2014) and individual parts, shown as stacked bar plot:"))
# IFrame(src="./out.html", width=500, height=500)
fig.show()