FREYA WP2 User Story 5 | As a student using the British Library's EThOS database, I want to be able to find all dissertations on a given topic. | |
---|---|---|
It is important for postgraduate students to identify easily existing dissertations on a research topic of interest.
This notebook uses the DataCite GraphQL API to retrieve all dissertations for three different queries: Shakespeare, Machine learning and Ebola. These queries illustrate trends in the number of dissertations created over time.Goal: By the end of this notebook you should be able to:
%%capture
# Install required Python packages
!pip install gql requests sklearn wordcloud numpy pandas
# Prepare the GraphQL client
import requests
from IPython.display import display, Markdown
from gql import gql, Client
from gql.transport.requests import RequestsHTTPTransport
_transport = RequestsHTTPTransport(
url='https://api.datacite.org/graphql',
use_json=True,
)
client = Client(
transport=_transport,
fetch_schema_from_transport=True,
)
Define the GraphQL query to retrieve all dissertations using three different queries (that yield distinct trends in number of dissertations across time): shakespeare, Machine learning and ebola.
# Define the GraphQL query: retrieve all dissertations for three different queries:
# Shakespeare, Machine learning and Ebola.
query_params = {
"query1" : "shakespeare",
"query2" : "Machine learning",
"query3" : "ebola",
"query1_end_cursor" : "",
"query2_end_cursor" : "",
"query3_end_cursor" : "",
"max_dissertations" : 100
}
queryStr = """query getDissertationsByQuery(
$query1: String!,
$query2: String!,
$query3: String!,
$query1_end_cursor: String!,
$query2_end_cursor: String!,
$query3_end_cursor: String!,
$max_dissertations: Int!
)
{
query1: dissertations(query: $query1, first: $max_dissertations, after: $query1_end_cursor) {
totalCount
pageInfo {
hasNextPage
endCursor
}
published {
count
title
}
nodes {
id
titles {
title
}
descriptions {
description
}
repository {
name
}
versionOfCount
identifiers {
identifier
}
publicationYear
bibtex
repository {
id
}
publisher
creators {
id
name
}
}
},
query2: dissertations(query: $query2, first: $max_dissertations, after: $query2_end_cursor) {
totalCount
pageInfo {
hasNextPage
endCursor
}
published {
count
title
}
nodes {
id
titles {
title
}
descriptions {
description
}
repository {
name
}
versionOfCount
identifiers {
identifier
}
publicationYear
bibtex
repository {
id
}
publisher
creators {
id
name
}
}
},
query3: dissertations(query: $query3, first: $max_dissertations, after: $query3_end_cursor) {
totalCount
pageInfo {
hasNextPage
endCursor
}
published {
count
title
}
nodes {
id
titles {
title
}
descriptions {
description
}
repository {
name
}
versionOfCount
bibtex
identifiers {
identifier
}
publicationYear
repository {
id
}
publisher
creators {
id
name
}
}
}
}
"""
Run the above query via the GraphQL client.
import json
found_next_page = True
# queries_with_more_results controls data for which query still needs to be collected from retrieved results
queries_with_more_results = ['query1', 'query2', 'query3']
# Initialise overall data dict that will store results across all queries
data = {}
# Keep retrieving results until there are no more results left for any of the three queries
while len(queries_with_more_results) > 0:
print('HEYYYYYYYYYYYYY')
query = gql("%s" % queryStr)
res = client.execute(query, variable_values=json.dumps(query_params))
for query in queries_with_more_results:
if query not in data:
data[query] = res[query]
else:
data[query]["nodes"].extend(res[query]["nodes"])
for query in ['query1', 'query2', 'query3']:
if query not in queries_with_more_results:
continue
cursor_params_key = query + "_end_cursor"
dissertations = res[query]
pageInfo = dissertations["pageInfo"]
if pageInfo["hasNextPage"]:
if pageInfo["endCursor"] is not None:
query_params[cursor_params_key] = pageInfo["endCursor"]
else:
query_params[cursor_params_key] = ""
queries_with_more_results.remove(query)
else:
query_params[cursor_params_key] = ""
queries_with_more_results.remove(query)
For each query, display the total number of dissertations.
# Get the total number of dissertations per query
for query in ['query1', 'query2', 'query3']:
print("The total number of dissertations for query '%s':\n%s" % (query_params[query], str(data[query]['totalCount'])))
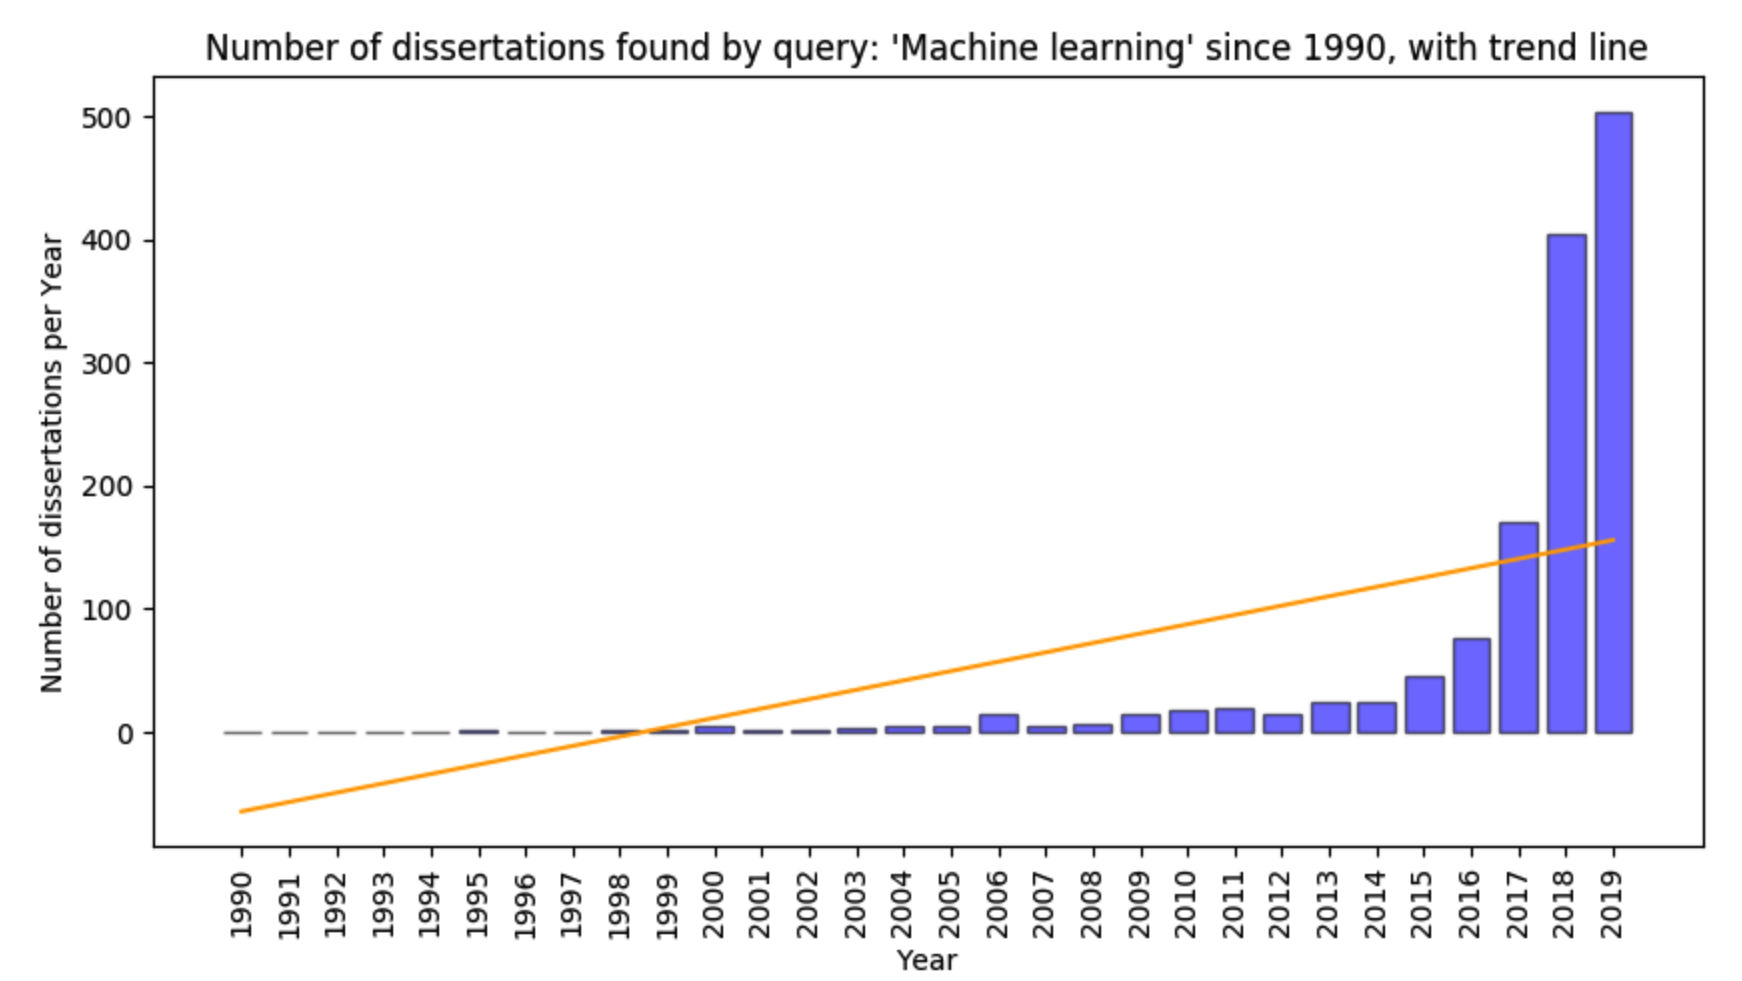
The total number of dissertations for query 'shakespeare': 133 The total number of dissertations for query 'Machine learning': 1940 The total number of dissertations for query 'ebola': 59
For each query, display a bar plot of number of dissertations per year, between start_year and end_year defined in code below. Also shown is a trend line, highlighting the general direction of change in dissertation numbers between start_year and end_year.
# Plot the number of dissertations by year
import matplotlib.pyplot as plt
from matplotlib.ticker import FormatStrFormatter
import numpy as np
import pandas as pd
from sklearn.linear_model import Ridge
start_year = 1990
end_year = 2020
for query in ['query1', 'query2', 'query3']:
dissertations = data[query]
queryName = query_params[query]
plt.rcdefaults()
years = [int(s['title']) for s in dissertations['published']]
num_outputs4years = [s['count'] for s in dissertations['published']]
# Get a list of all consecutive years between min and max year (inclusive)
all_years = list(range(start_year, end_year))
# Populate output counts (into num_counts) for all consecutive years
num_outputs = []
for year in all_years:
if year in years:
idx = years.index(year)
num_outputs.append(num_outputs4years[idx])
else:
num_outputs.append(0)
df = pd.DataFrame({'Year': all_years, 'Count': num_outputs} )
# Create trend line for the plot
lr = Ridge()
lr.fit(df[['Year']], df['Count'])
fig, ax = plt.subplots(1, 1, figsize = (10, 5))
ax.bar(df['Year'], df['Count'], align='center', color='blue', edgecolor='black', linewidth=1, alpha=0.5)
ax.set_xticks(df['Year'])
ax.set_xticklabels(all_years, rotation='vertical')
ax.set_ylabel('Number of dissertations per Year')
ax.set_xlabel('Year')
ax.set_title("Number of dissertations found by query: '%s' since %s, with trend line" % (query_params[query], str(start_year)))
ax.plot(df['Year'], lr.coef_*df['Year']+lr.intercept_, color='orange')
plt.show()
For each query, display a pie chart showing the number of dissertations per repository.
# Plot a pie chart of dissertation counts per repository
import matplotlib.pyplot as plt
from matplotlib.ticker import FormatStrFormatter
import numpy as np
import operator
for query in ['query1', 'query2', 'query3']:
# for query in ['query1']:
num_outputs_dict = {}
dissertations = data[query]
for r in dissertations['nodes']:
repo = r['repository']['name']
if repo not in num_outputs_dict:
num_outputs_dict[repo] = 0
num_outputs_dict[repo] += 1
# Sort resource types by count of work desc
sorted_num_outputs = sorted(num_outputs_dict.items(),key=operator.itemgetter(1),reverse=True)
# Populate lists needed for pie chart
repositories = [s[0] for s in sorted_num_outputs]
num_outputs = [s[1] for s in sorted_num_outputs]
# Generate a pie chart of number of grant outputs by resource type
fig = plt.figure()
ax = fig.add_axes([0,0,1,1])
ax.set_title("Number of Dissertations found by query: '%s' Per Repository" % query_params[query])
ax.axis('equal')
ax.pie(num_outputs, labels = repositories, autopct='%1.0f%%')
plt.show()
For each query, display a wordcloud of words in dissertation titles and descriptions
from wordcloud import WordCloud, STOPWORDS
import matplotlib.pyplot as plt
import pandas as pd
stopWords = set(STOPWORDS)
stopWords.add('_')
for query in ['query1', 'query2', 'query3']:
titleWords=[]
dissertations = data[query]
for r in dissertations['nodes']:
for title in r['titles']:
tokens = [t.lower() for t in str(title['title']).split()]
for title in r['descriptions']:
tokens = [t.lower() for t in str(title['description']).split()]
titleWords += tokens
x, y = np.ogrid[:800, :800]
mask = (x - 400) ** 2 + (y - 400) ** 2 > 345 ** 2
mask = 255 * mask.astype(int)
wordcloud = WordCloud(width = 600, height = 600,
background_color ='white',
stopwords = stopWords,
min_font_size = 10,
mask = mask).generate(" ".join(titleWords))
fig, ax = plt.subplots(1, 1, figsize = (8, 8), facecolor = None)
ax.set_title("Word cloud of titles of maximum %d dissertations found by query: '%s'" % (query_params['max_dissertations'],query_params[query]))
plt.imshow(wordcloud, interpolation="bilinear")
plt.axis("off")
plt.tight_layout(pad = 0)
plt.show()
For each query, download a file of dissertation entries in BibTeX format.
import pandas as pd
from IPython.display import Javascript
from requests.utils import requote_uri
# For each query, download a file containing BibTeX entries of all dissertations
for query in ['query1', 'query2', 'query3']:
dissertations = data[query]
bibtex_data = []
for r in dissertations['nodes']:
bibtex_data.append([r['bibtex']])
df = pd.DataFrame(bibtex_data, columns = None)
js_download = """
var csv = '%s';
var filename = '%s.bib';
var blob = new Blob([csv], { type: 'application/x-bibtex;charset=utf-8;' });
if (navigator.msSaveBlob) { // IE 10+
navigator.msSaveBlob(blob, filename);
} else {
var link = document.createElement("a");
if (link.download !== undefined) { // feature detection
// Browsers that support HTML5 download attribute
var url = URL.createObjectURL(blob);
link.setAttribute("href", url);
link.setAttribute("download", filename);
link.style.visibility = 'hidden';
document.body.appendChild(link);
link.click();
document.body.removeChild(link);
}
}
""" % (df.to_csv(index=False, header=False).replace('\n','\\n').replace("\'","\\'").replace("\"","").replace("\r",""), requote_uri(query_params[query]))
# display(Javascript(js_download))