FREYA WP2 User Story 2 | As a software author, I want to be able to see the citations of my software aggregated across all versions, so that I see a complete picture of reuse. | |
---|---|---|
Software development process involves versioned releases. Consequently, different software versions may be used for scientific discovery and thus referenced in publications. In order to quantify impact of a software, its author must be able to capture the reuse of the software across all its versions.
This notebook uses the DataCite GraphQL API to retrieve metadata about software titled: Calculation Package: Inverting topography for landscape evolution model process representation, including all its versions, so that its overall reuse can be quantified.Goal: By the end of this notebook, for a given software you should be able to display:
%%capture
# Install required Python packages
!pip install gql requests numpy plotly
# Prepare the GraphQL client
import requests
from IPython.display import display, Markdown
from gql import gql, Client
from gql.transport.requests import RequestsHTTPTransport
_transport = RequestsHTTPTransport(
url='https://api.datacite.org/graphql',
use_json=True,
)
client = Client(
transport=_transport,
fetch_schema_from_transport=True,
)
Define the GraphQL query to retrieve metadata for the software titled: Calculation Package: Inverting topography for landscape evolution model process representation using its DOI.
# Generate the GraphQL query to retrieve the required software's metadata
query_params = {
"softwareId" : "https://doi.org/10.5281/zenodo.2799488"
}
query = gql("""query getSoftware($softwareId: ID!)
{
software(id: $softwareId) {
id
titles {
title
}
publicationYear
citations {
nodes {
id
titles {
title
}
}
}
version
versionCount
versionOfCount
citationCount
downloadCount
viewCount
versions {
nodes {
id
version
publicationYear
titles {
title
}
citations {
nodes {
id
titles {
title
}
}
}
version
versionCount
versionOfCount
citationCount
downloadCount
viewCount
}
}
}
}
""")
Run the above query via the GraphQL client
import json
data = client.execute(query, variable_values=json.dumps(query_params))
Display total number of citations, views and downloads across all versions of software: Calculation Package: Inverting topography for landscape evolution model process representation.
# Get the total count per metric, aggregated for across all versions of the software
software = data['software']
# Initialise metric counts
metricCounts = {}
for metric in ['citationCount', 'viewCount', 'downloadCount']:
metricCounts[metric] = 0
# Aggregate metric counts across all the version
for node in software['versions']['nodes']:
for metric in metricCounts:
metricCounts[metric] += node[metric]
# Display the aggregated metric counts
tableBody=""
for metric in metricCounts:
tableBody += "%s | **%s**\n" % (metric, str(metricCounts[metric]))
if tableBody:
display(Markdown("Aggregated metric counts for software: [Calculation Package: Inverting topography for landscape evolution model process representation](https://doi.org/10.5281/zenodo.2799488) across all its versions:"))
display(Markdown("|Metric | Aggregated Count|\n|---|---|\n%s" % tableBody))
Aggregated metric counts for software: Calculation Package: Inverting topography for landscape evolution model process representation across all its versions:
Metric | Aggregated Count |
---|---|
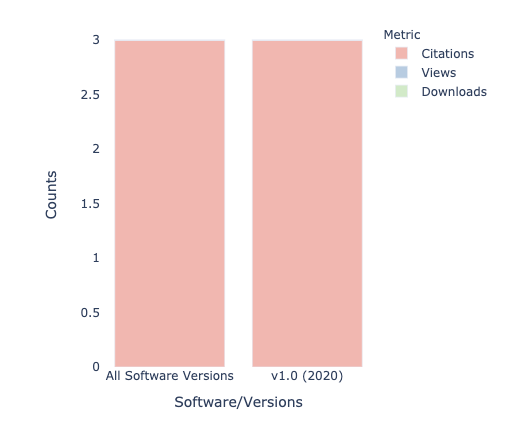
citationCount | 3 viewCount | 0 downloadCount | 0
Plot stacked bar plot showing how the individual versions of software: Calculation Package: Inverting topography for landscape evolution model process representation contribute their metric counts to the corresponding aggregated total.
import plotly.io as pio
import plotly.express as px
from IPython.display import IFrame
import pandas as pd
import chart_studio.plotly as py
# Adapted from: https://stackoverflow.com/questions/58766305/is-there-any-way-to-implement-stacked-or-grouped-bar-charts-in-plotly-express
def px_stacked_bar(df, color_name='Metric', y_name='Metrics', **pxargs):
idx_col = df.index.name
m = pd.melt(df.reset_index(), id_vars=idx_col, var_name=color_name, value_name=y_name)
# For Plotly colour sequences see: https://plotly.com/python/discrete-color/
return px.bar(m, x=idx_col, y=y_name, color=color_name, **pxargs,
color_discrete_sequence=px.colors.qualitative.Pastel1)
# Collect metric counts
software = data['software']
version = software['version']
# Initialise dicts for the stacked bar plot
labels = {0: 'All Software Versions'}
citationCounts = {}
viewCounts = {}
downloadCounts = {}
# Collect software/version labels
versionCnt = 1
for node in software['versions']['nodes']:
version = software['version']
labels[versionCnt] = '%s (%s)' % (version, node['publicationYear'])
versionCnt += 1
# Initialise aggregated metric counts (key: 0)
citationCounts[0] = 0
viewCounts[0] = 0
downloadCounts[0] = 0
# Populate metric counts for individual versions (key: versionCnt) and add them to the aggregated counts (key: 0)
versionCnt = 1
for node in software['versions']['nodes']:
citationCounts[0] += node['citationCount']
viewCounts[0] += node['viewCount']
downloadCounts[0] += node['downloadCount']
citationCounts[versionCnt] = node['citationCount']
viewCounts[versionCnt] = node['viewCount']
downloadCounts[versionCnt] = node['downloadCount']
versionCnt += 1
# Create stacked bar plot
df = pd.DataFrame({'Software/Versions': labels,
'Citations': citationCounts,
'Views': viewCounts,
'Downloads': downloadCounts})
fig = px_stacked_bar(df.set_index('Software/Versions'), y_name = "Counts")
# Set plot background to transparent
# fig.update_layout({
# 'plot_bgcolor': 'rgba(0, 0, 0, 0)',
# 'paper_bgcolor': 'rgba(0, 0, 0, 0)'
# })
# Write interactive plot out to html file
pio.write_html(fig, file='out.html')
# Display plot from the saved html file
display(Markdown("Citations, views and downloads counts for software: [Calculation Package: Inverting topography for landscape evolution model process representation](https://doi.org/10.5281/zenodo.2799488) across all its versions, shown as stacked bar plot:"))
# IFrame(src="./out.html", width=500, height=500)
fig.show()

Citations, views and downloads counts for software: Calculation Package: Inverting topography for landscape evolution model process representation across all its versions, shown as stacked bar plot: